THE RESPONDENTS
Respondents
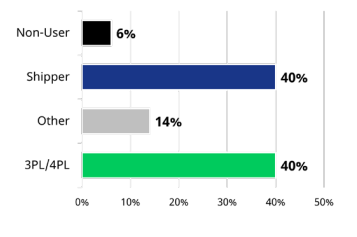
Figure 6.1 shows the percentage of shipper respondents to the survey, including both users (40%) and non-users (6%) of 3PL services, and the percentage of 3PL or 4PL respondents (40%). The non-user responses are helpful because they provide valuable insights on why some organizations have elected not to use 3PLs, as well as their perspective on several other relevant topics throughout the study. Consultants and other industry leaders made up 14% of respondents.
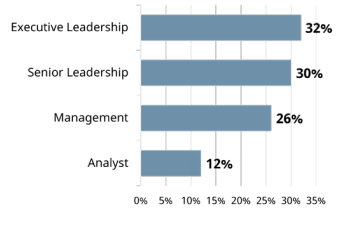
Respondents are typically vice presidents, directors, senior directors or managers and above from a mixture of different industries, as shown in Figure 6.2.
Shippers
Figure 6.3 shows the 10 most prominent industries reported by users of 3PL services, including the top three: food and beverage manufacturing or distribution (20%), high- tech and consumer electronics (15%), and consumer package goods (10%).
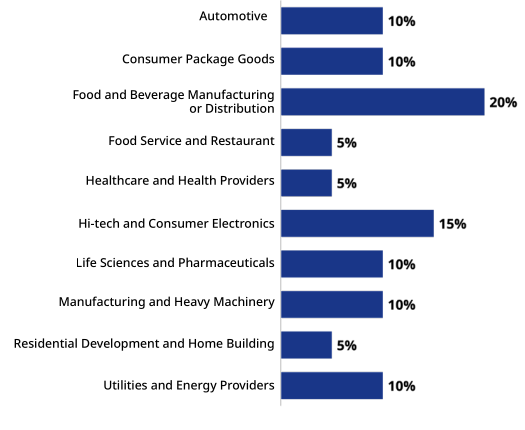
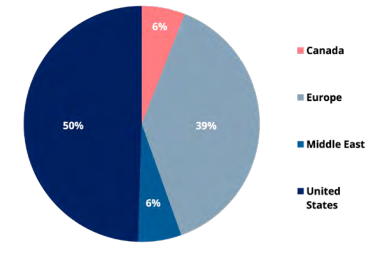
Figure 6.4 groups shippers by geographic location. A high concentration of shippers operate in the US (50%) and Europe (39%).
3PLs
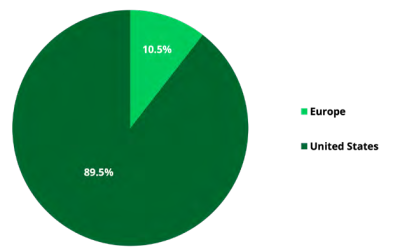
3PL executives and senior leaders responded to a similar but separate version of the survey. Since most 3PL respondents service multiple geographical areas, the study team asked them to select all major geographies where they provide service, as shown in Figure 6.6. Most respondents are US-based (89%).
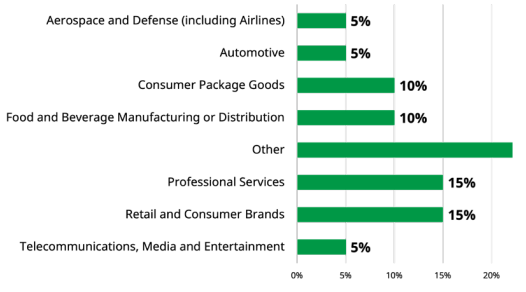
3PL respondents represent a wide range of industries, from retail and consumer brands (15%) to consumer-packaged goods (10%) and food and beverage manufacturing or distribution (10%), as shown in Figure 6.7.