THE RESPONDENTS
Shippers
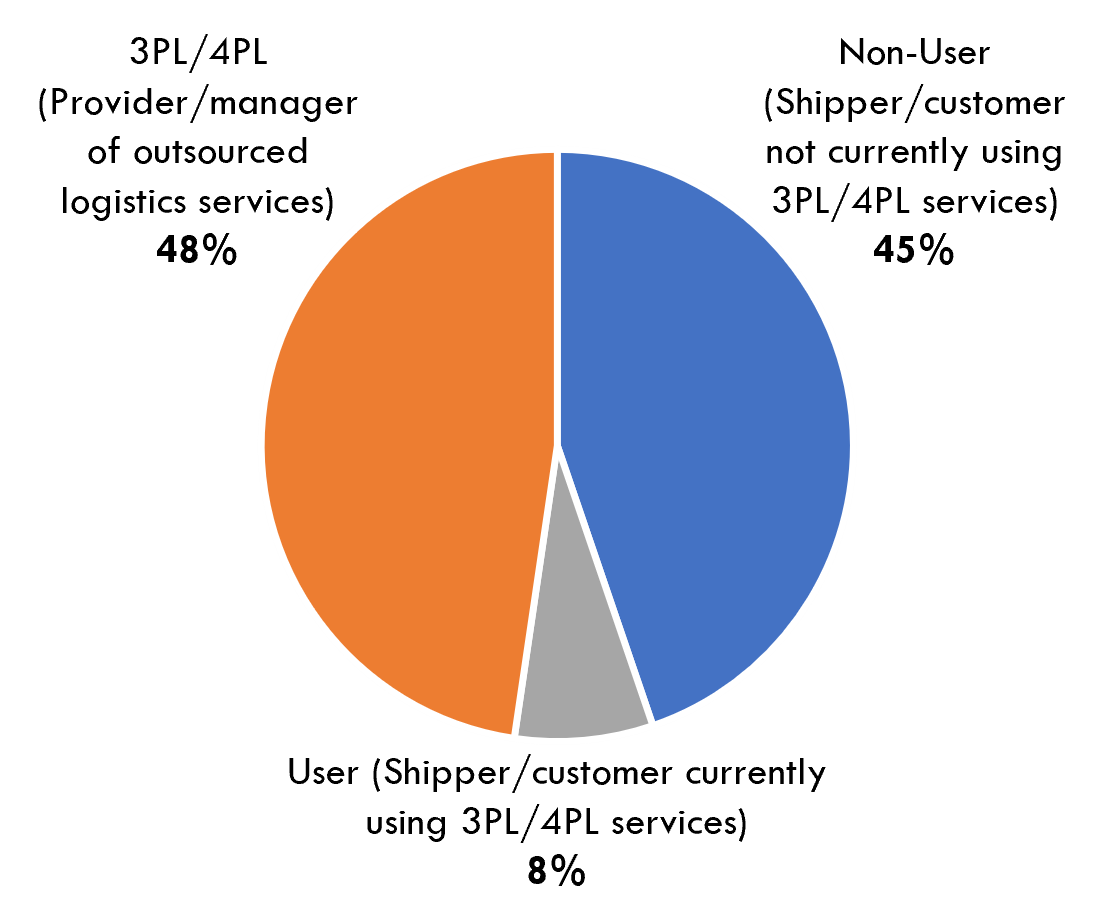
Figure 48 shows the percentage of shipper respondents to the survey, including both users (45%) and non-users (8%) of 3PL services, and the percentage of 3PLs (48%). The non-user responses are helpful because they provide valuable insights on why some organizations have elected not to use 3PLs, as well as non-user perspectives on several other relevant topics throughout the study.
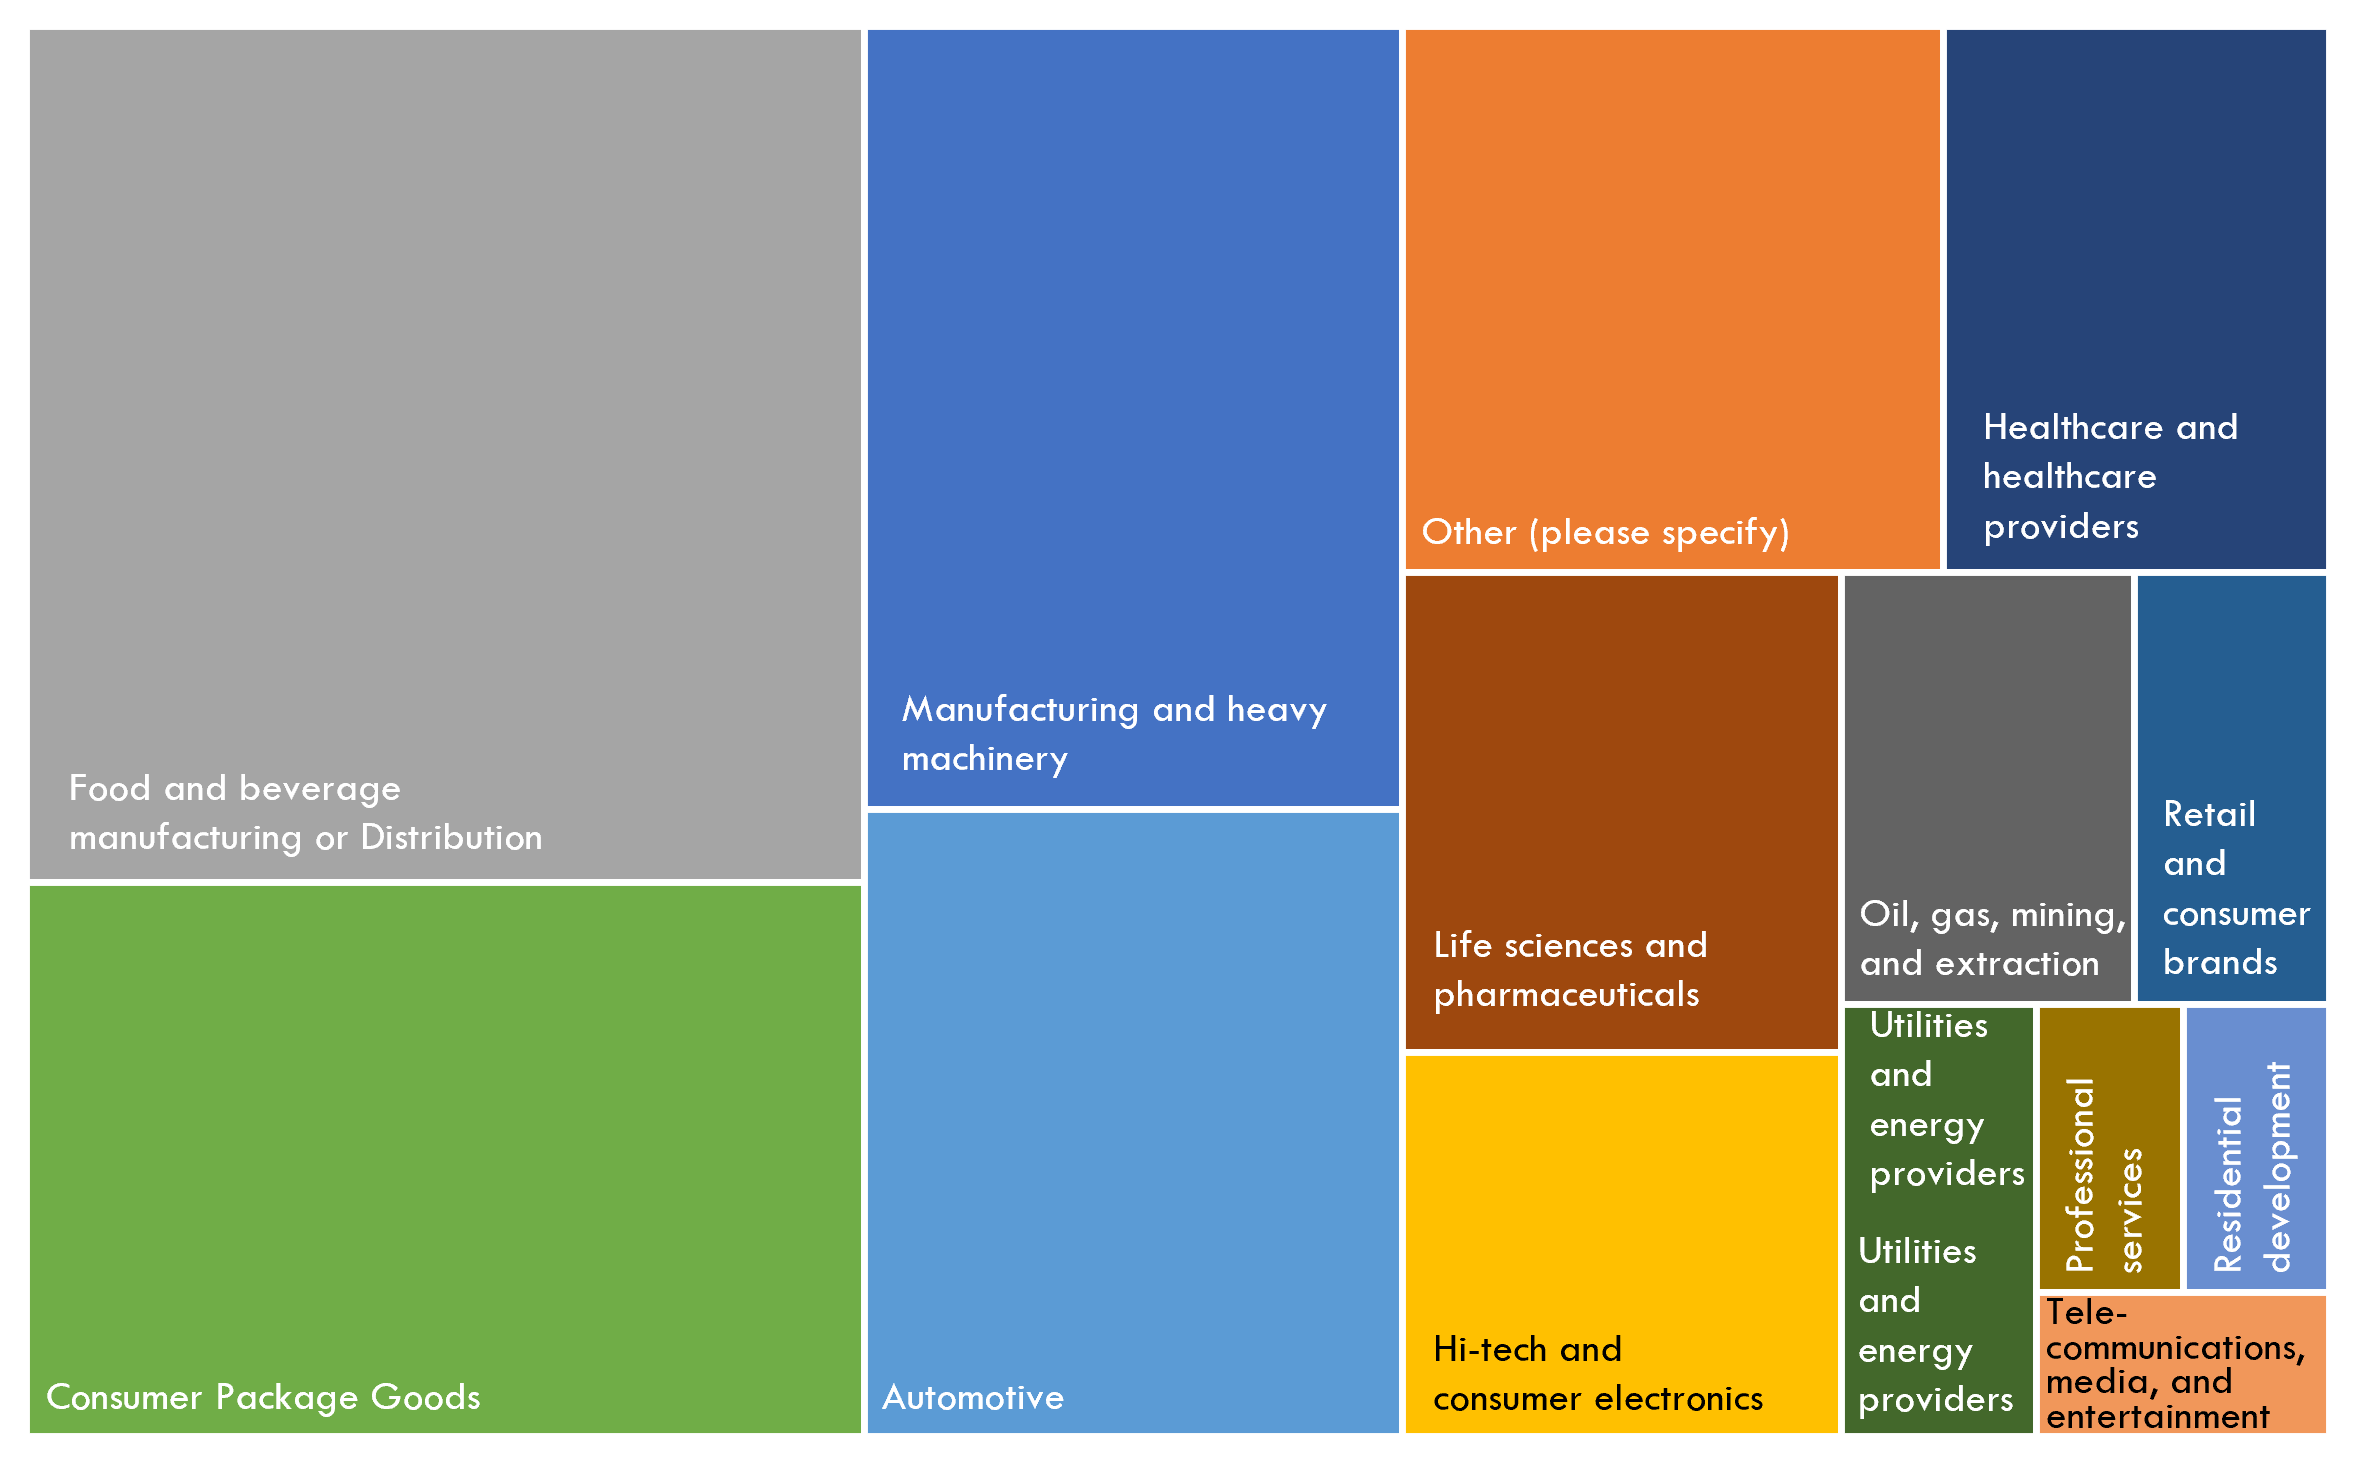
Shipper respondents are typically senior managers, directors, vice presidents and above from a mixture of different industries. Figure 49 shows the 10 most prominent industries reported by users of 3PL services, including food and beverage manufacturing or distribution (22%), CPG (14%), retail and consumer brands (3%), manufacturing and heavy machinery (13%), and automotive (10%).
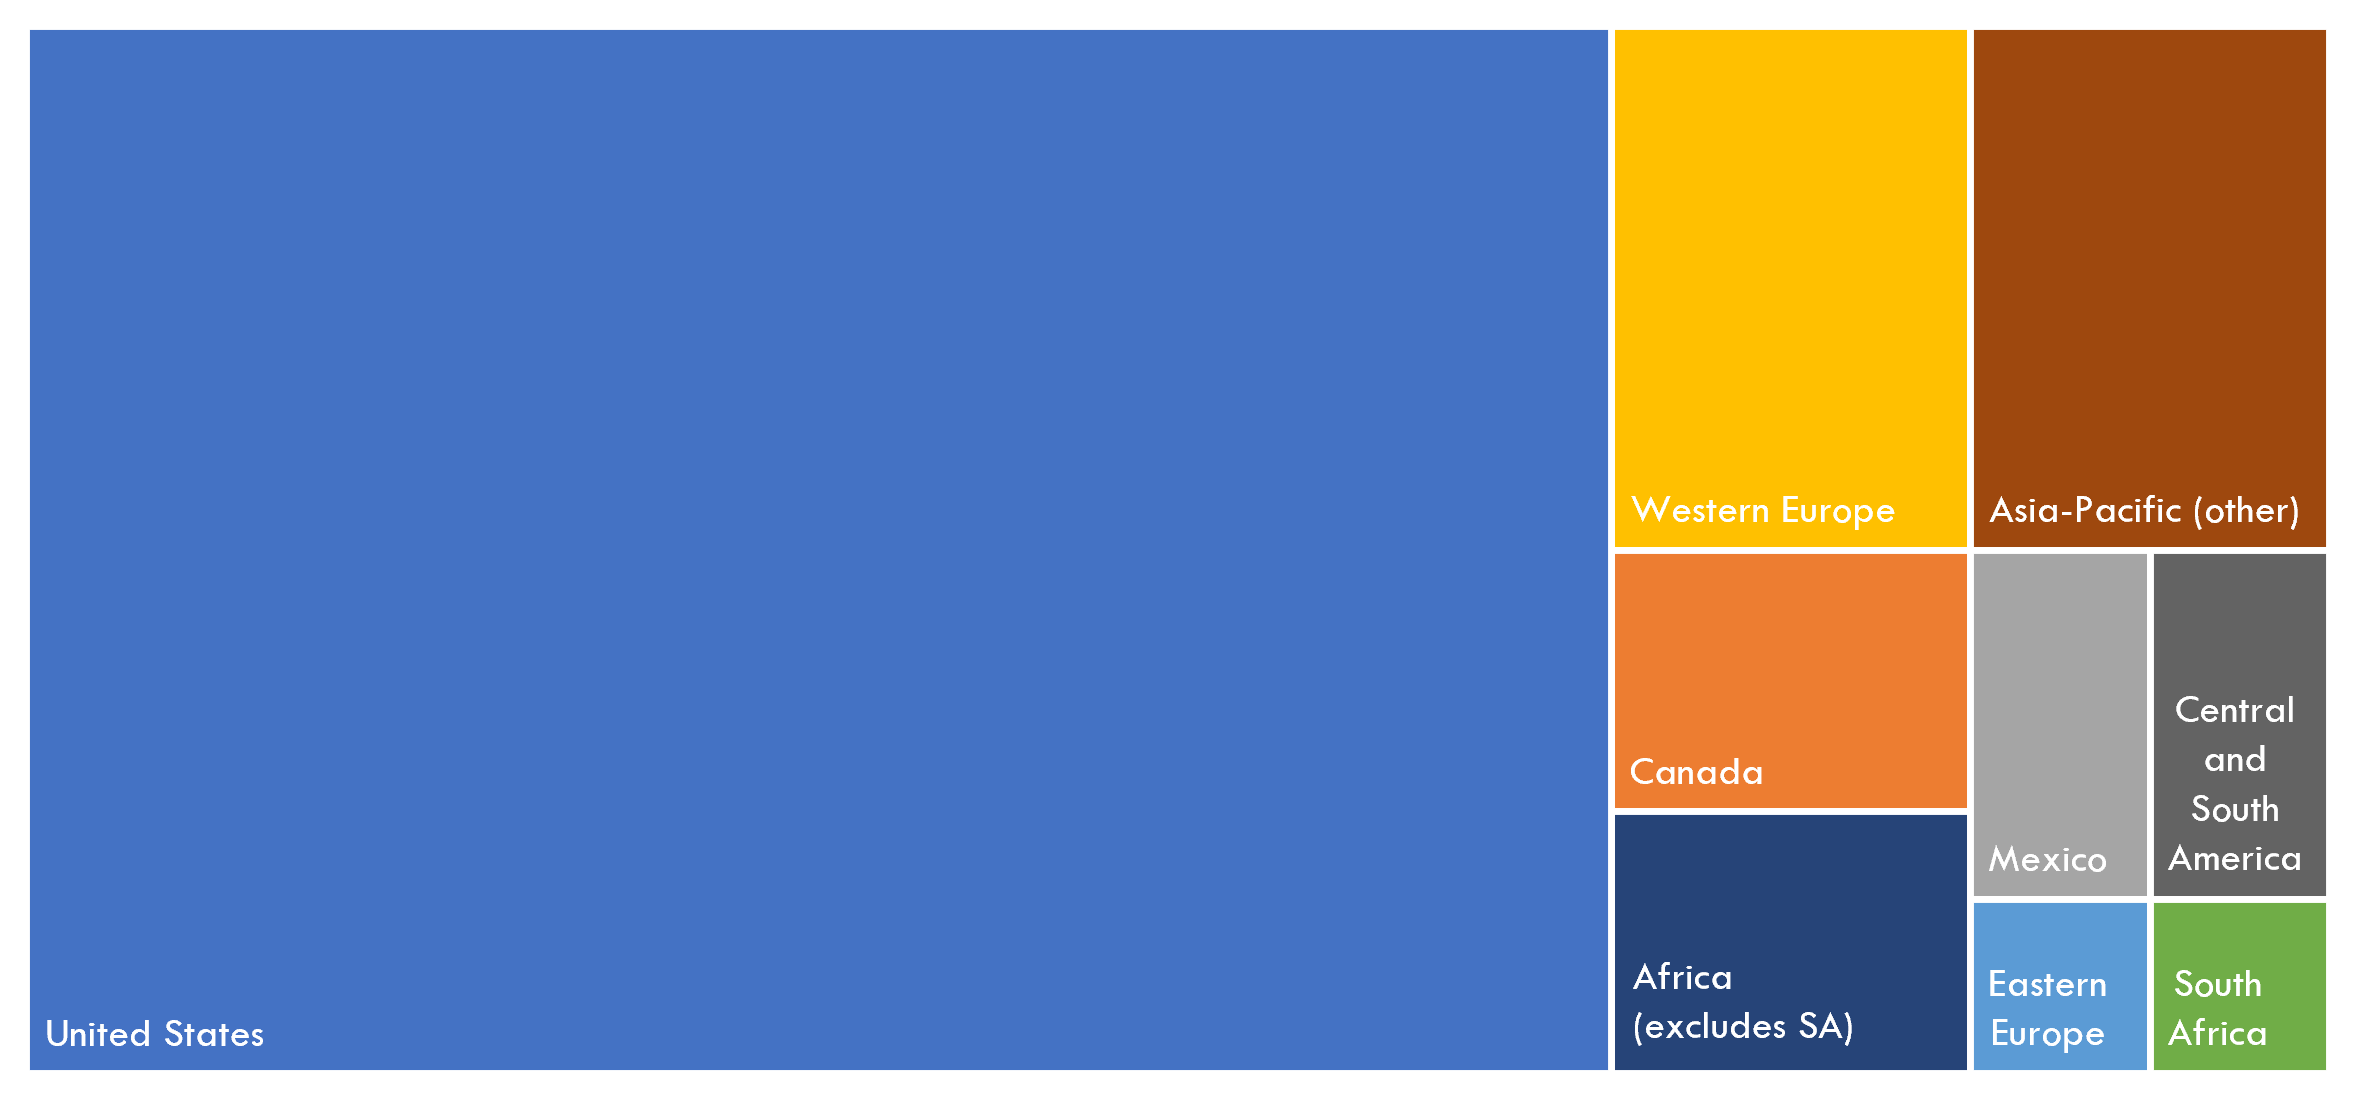
Figure 50 groups shippers by geographic location. A high concentration of shippers have their base location in the U.S. (69%). Other top locations include Europe (9%), Canada (4%) and Mexico (3%). (Asia accounted for 8%.)
Shipper respondents represented a diverse group based on total annual sales, with no significant variance year-over-year in any one response cluster (see Figure 51). Among shipper respondents, 66% reported $1 billion in sales or greater this year. This response was up slightly from last year, when 54% of shippers reported $1 billion or greater in sales.
3PL Providers
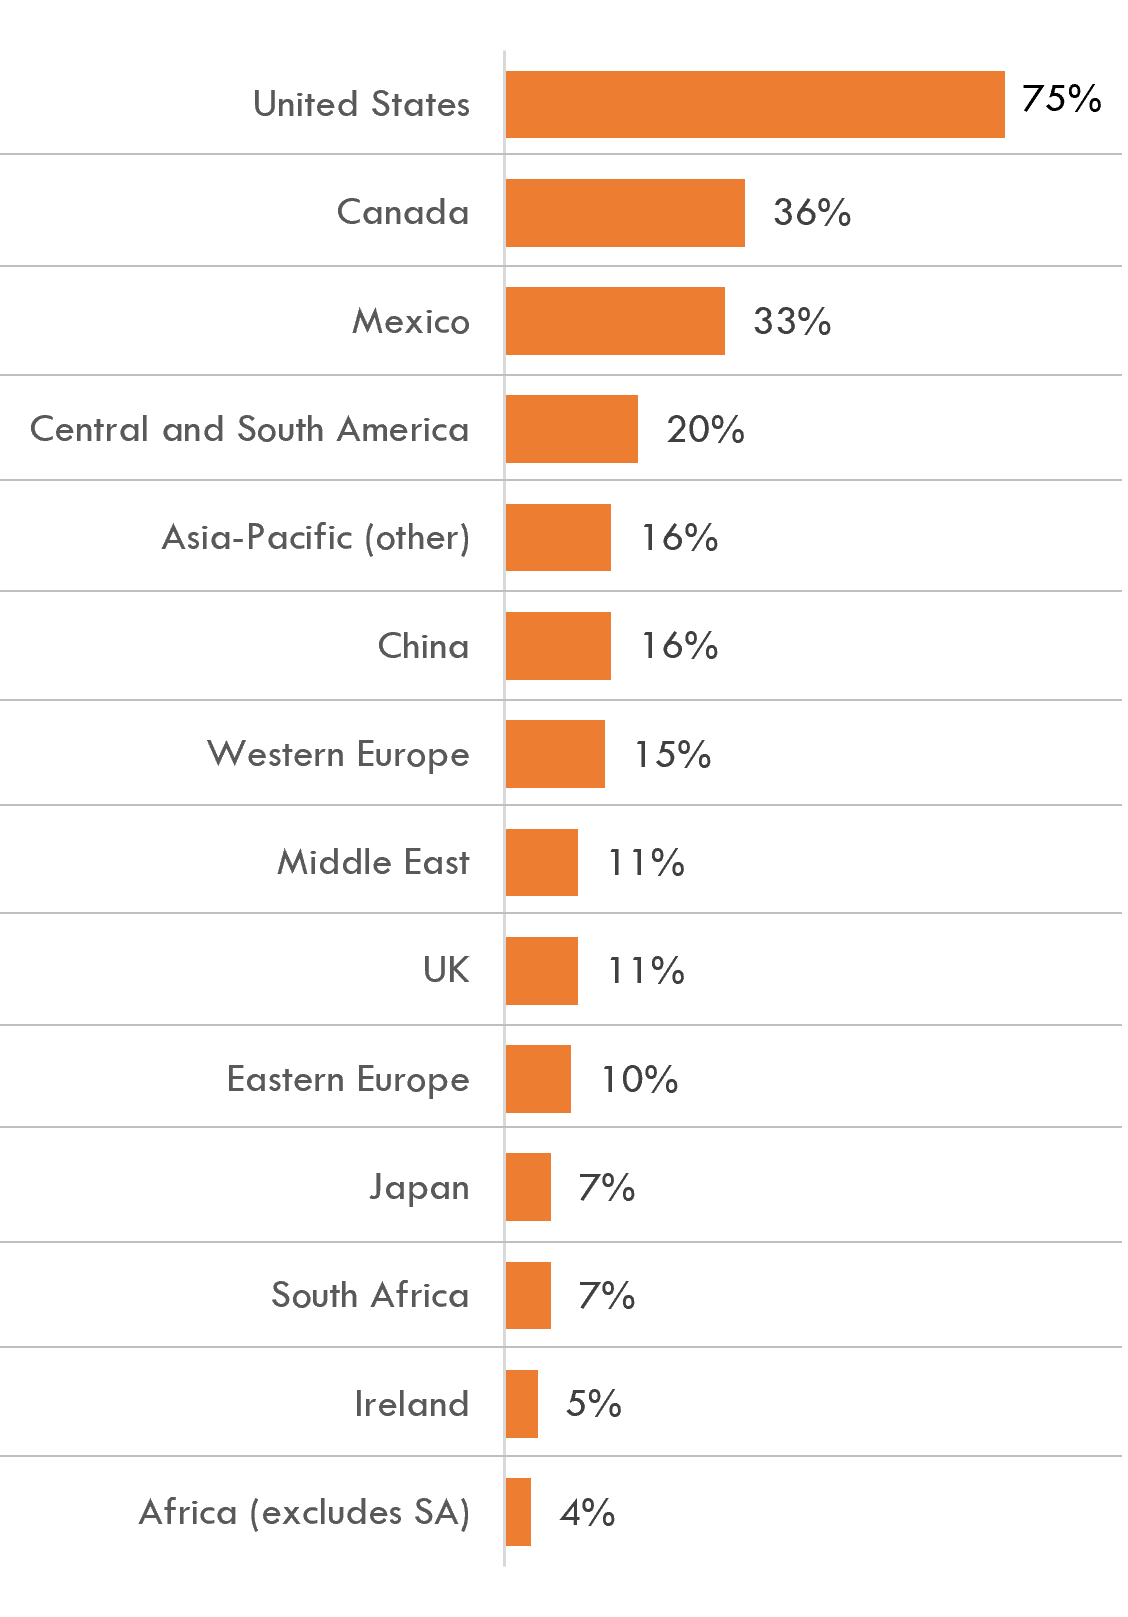
3PL executives and senior leaders responded to a similar, yet separate version of the survey. Since 3PL respondents tend to service multiple geographically areas, the study team asked them to select all major geographies for which they provide service (see Figure 52). North America continues to be the single largest service area at 75%, but all major geographies are represented.
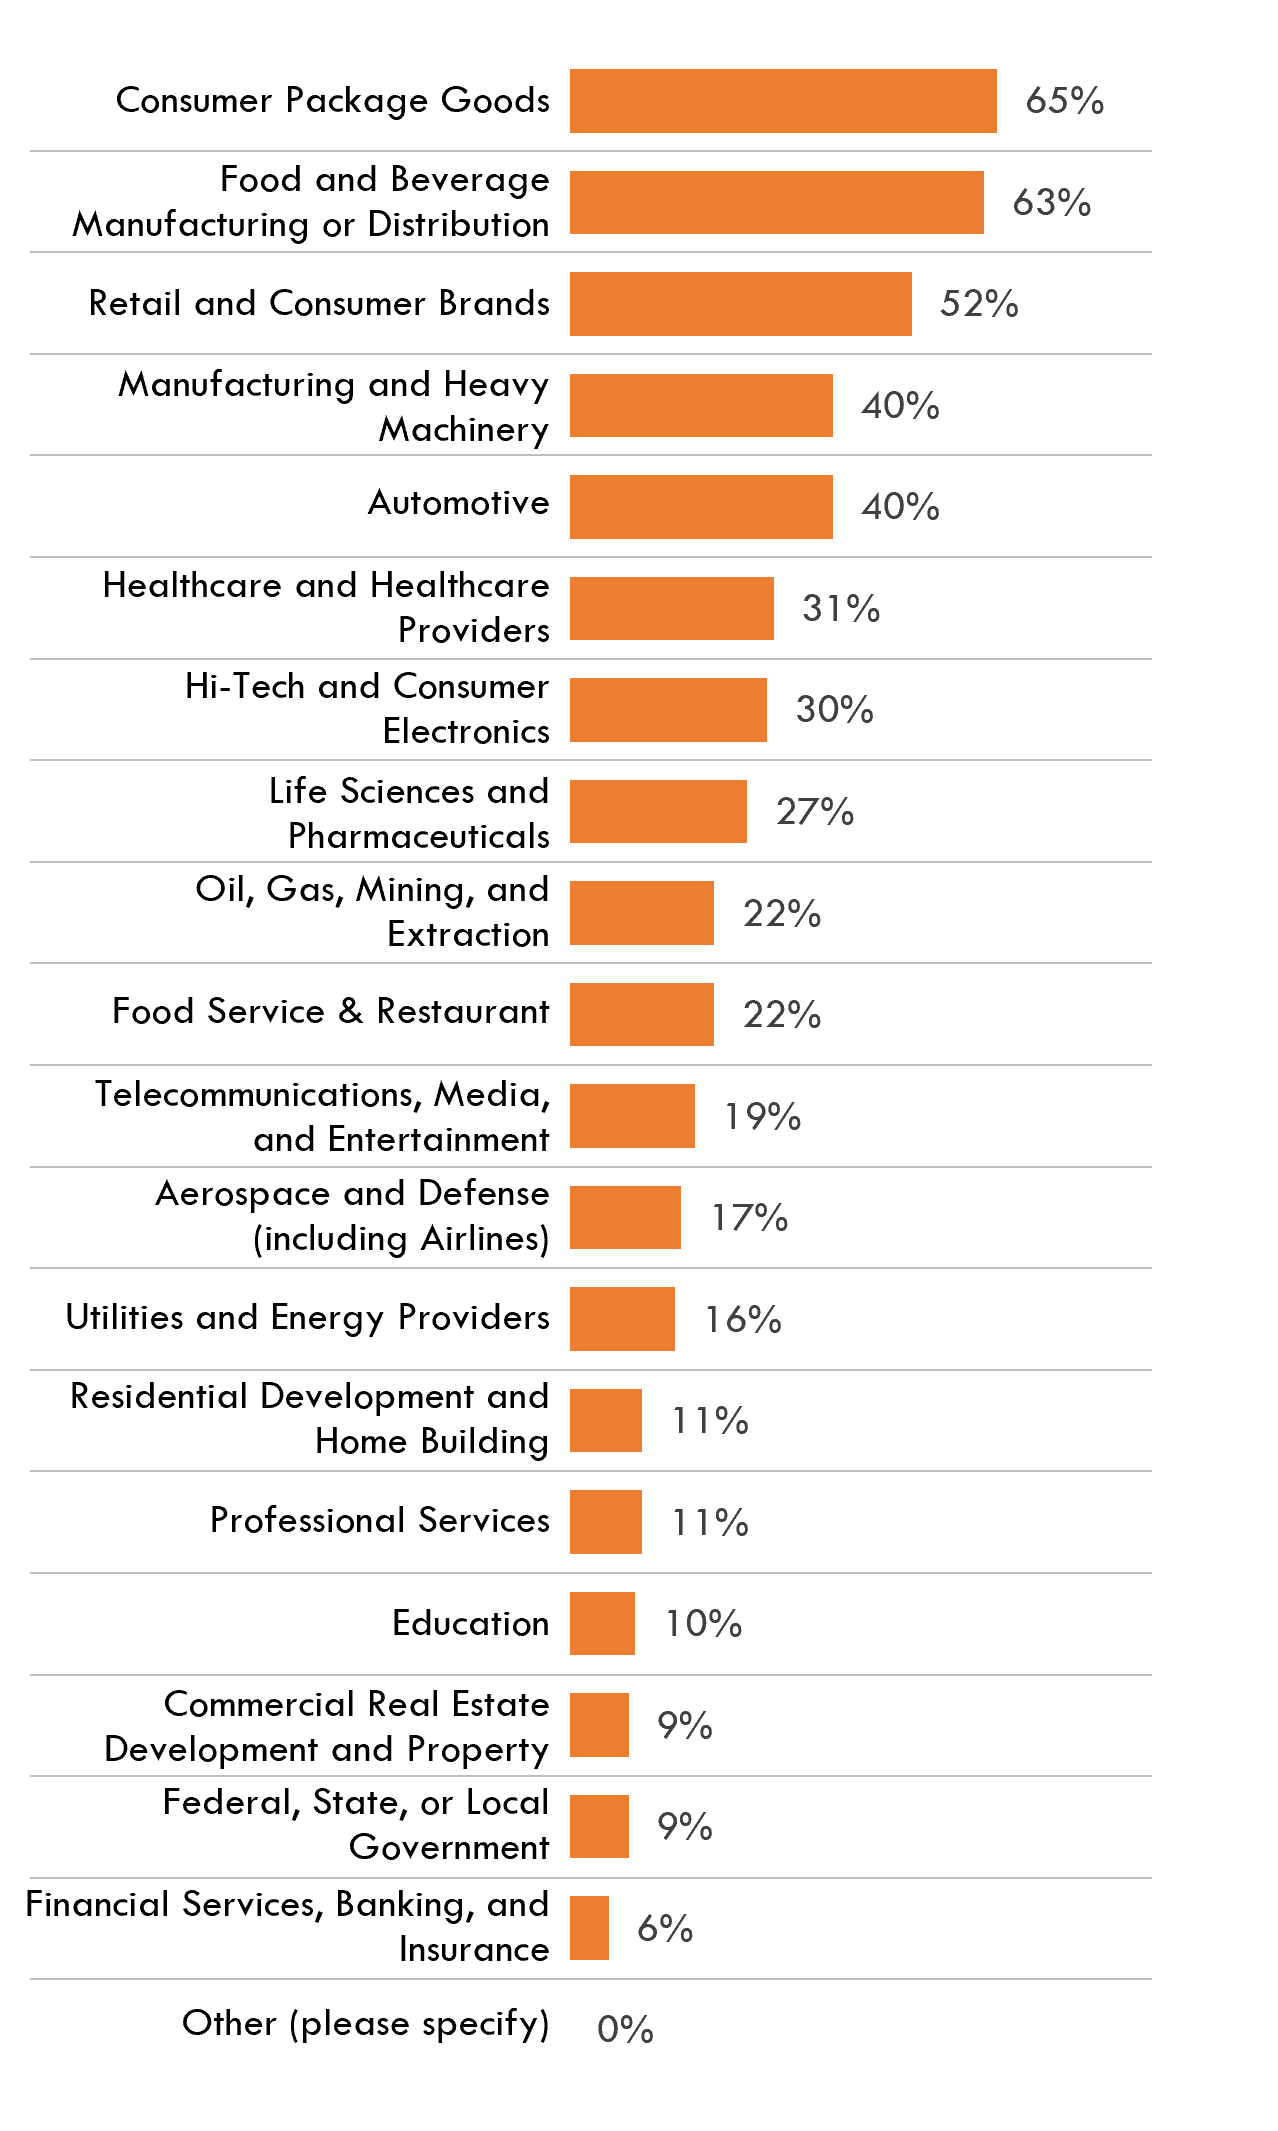
3PL respondents service a diverse group of industries, ranging from consumer-packaged goods (CPG) - 65% - to financial services and insurance (FSI) - 6% - and government organization at the federal, state and local segments - 9% (see Figure 53). Overall, 3PL respondents work primarily with those industries that have a direct-to-consumer element. These include retail, consumer brands, CPG, consumer electronics, and food and beverage.
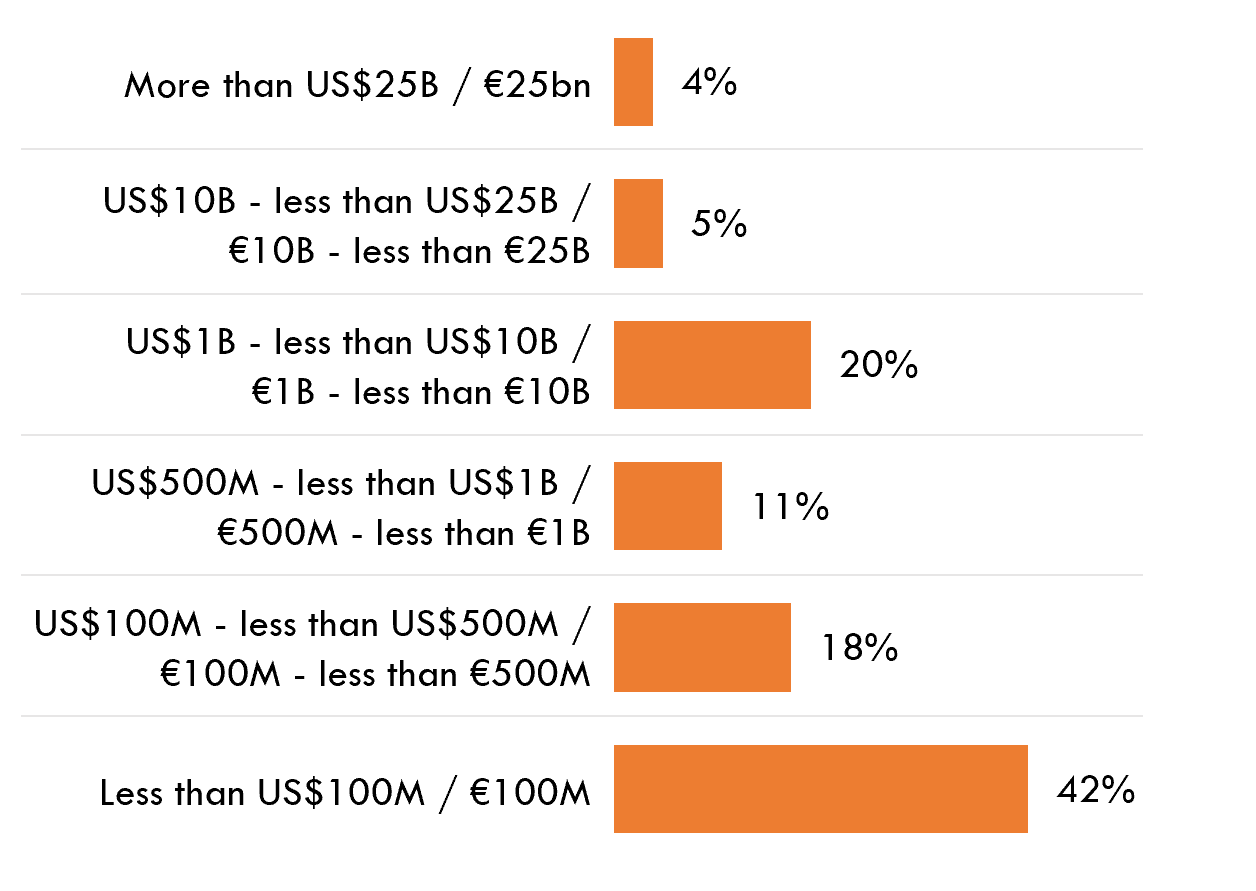
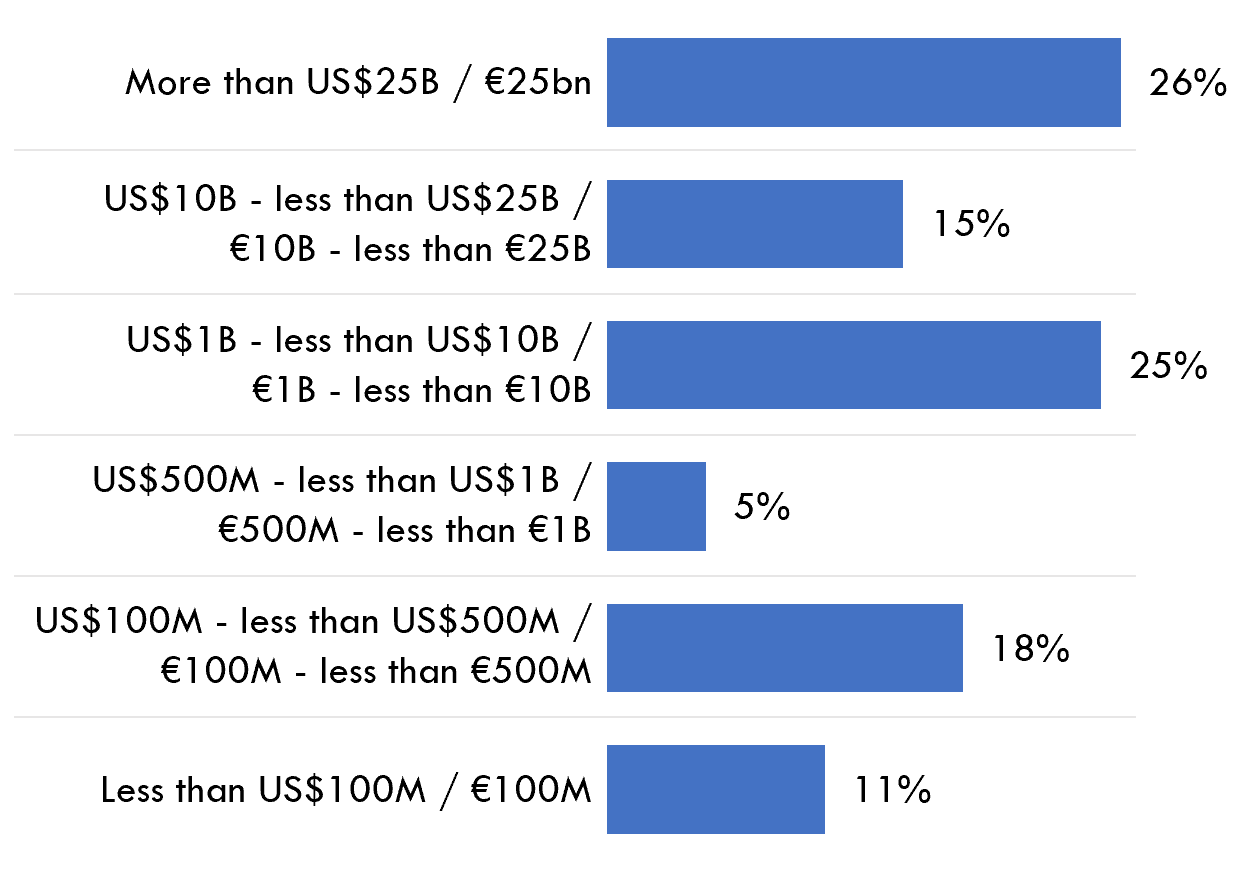
3PL respondents represented a diverse group based on total annual sales, with 29% of 3PLs reporting $1 billion in sales or greater this year and 42% reporting less than $100 million in total annual revenue (see Figure 54).